It’s no doubt that TRON is getting more popular in the past 3 months, let’s have a more in-depth look at how it actually performed from January 1, 2018, to March 31, 2018. TronLive have compiled some data from Google Trends and CoinMarketCap and we’ve found some interesting observation to share it with you. Do also note that the accuracy of data will, therefore, depended on what we obtained from these two services.
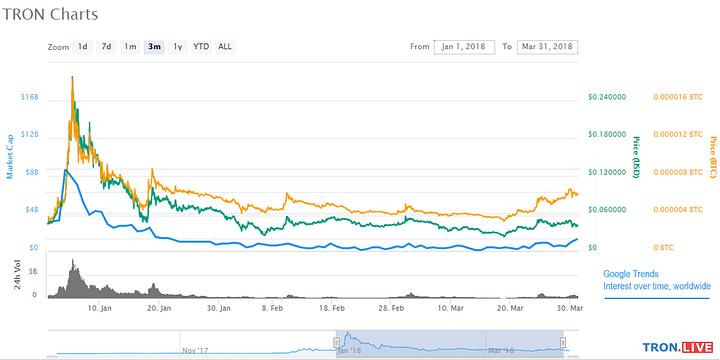

The graph above was generated with CoinMarketCap.
Green — Price of TRON in USD
Orange — Price of TRON in BTC
Blue — Google Trends data showing people’s interest over time, based on the keyword TRON
After we overlapped the data from Google Trends onto the CoinMarketCap graph, we can see that the amount of interest from the public closely matched the patterns for the price of TRON. That is, the more people who showed interest in TRON by looking it up on Google, the higher the price of TRON gets. Or, it can be the other way around as well — the higher the price of TRON gets, the more people will look it up on Google. Either way, there is a close connection between these two data-sets.
TRON gaining popularity
TronLive took four cryptocurrencies (tron, bitcoin, ethereum, litecoin) and plugged them into Google trends search for Q1. For those who are not familiar with Google trends, it gives you the trend of the keywords you are looking for to show you the interest of people over a given period of time.

Of course, bitcoin still dominates the search trend since that is what media covers the most, let’s take out bitcoin and observe the graph again.
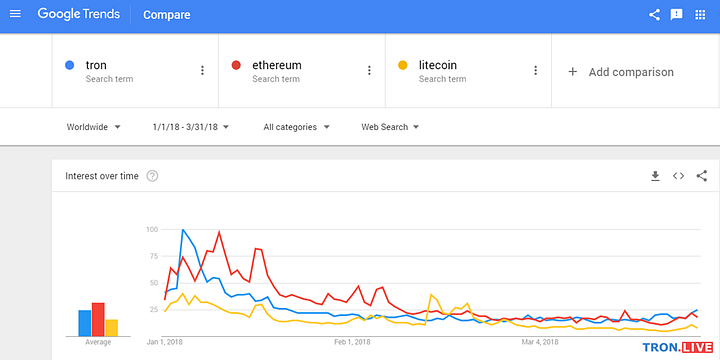
We can see that people actually gave a lot of attention to TRON when we compared it to Ethereum and Litecoin where both are years ahead of TRON’s ICO date.
TRON’s notable dates in Q1 2018
Jan 1, 2018
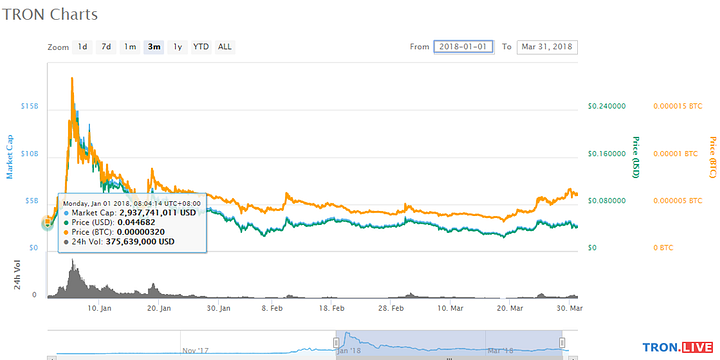
At the start of the year, TRON had a market cap of 2,937,741,011 USD
TRON’s price for USD: 0.044682 and
TRONS’s price for BTC: 0.00000320
In four days, TRON reaches its All Time High (ATH). TRON’s price in USD increased by 522% in 4 days since Jan 1. There were some possible causes that led to this. One of then is when Justin introduced the Tron dogs game (officially known as Pet Planet) on Jan 1 and Jan 3 after collaborating with Game.com. The other possible cause is on Jan 3 when Justin tweeted about announcing “partnership with a very prestigious public listed company” on the following week.
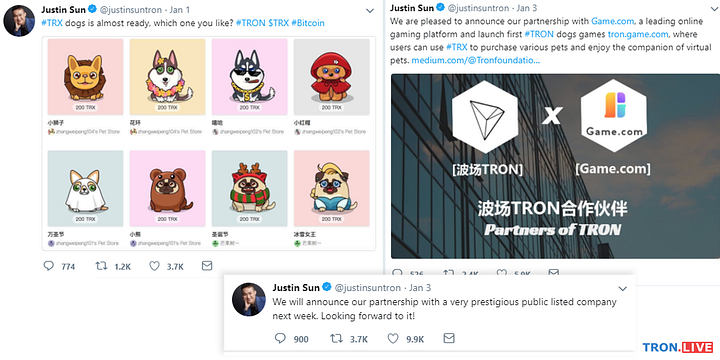
Jan 5, 2018
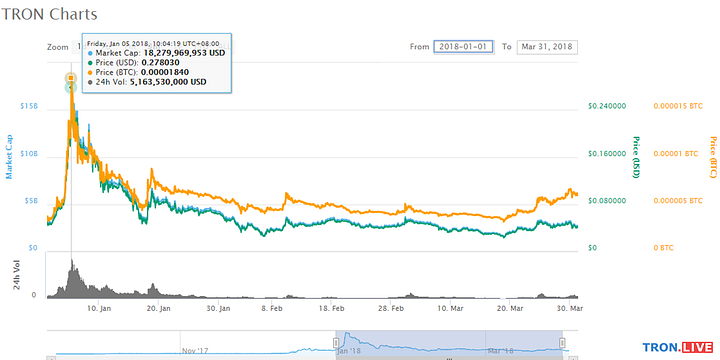
On Jan 5, TRON reaches its ATH and had a market cap of 18,279,969,953 USD
TRON’s price for USD: 0.278030 and
TRONS’s price for BTC: 0.00001840
A lot of people had Fear of Missing Out (FOMO) that time because they were afraid to miss the train for TRON to hit $1 within a week if this trend continues. Unfortunately, the hype exceeds the reality that time and the market crashed. Whales are dumping, people panic selling, bringing TRON’s price back to $0.046464 (0.00000432 BTC) on Jan 17, 2018. There were some ups and downs afterward slowly bringing TRON to its All Time Low (ATL) this year on March 18, 2018.
Mar 18, 2018
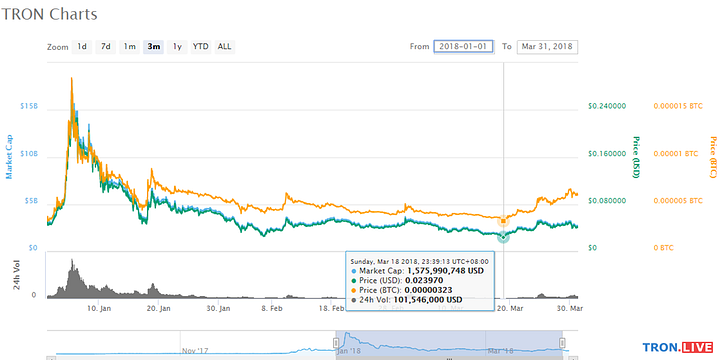
On Mar 18, TRON reaches its ATL for Q1 and had a market cap of 1,575,990,748 USD
TRON’s price for USD: 0.23970 and
TRONS’s price for BTC: 0.00000323
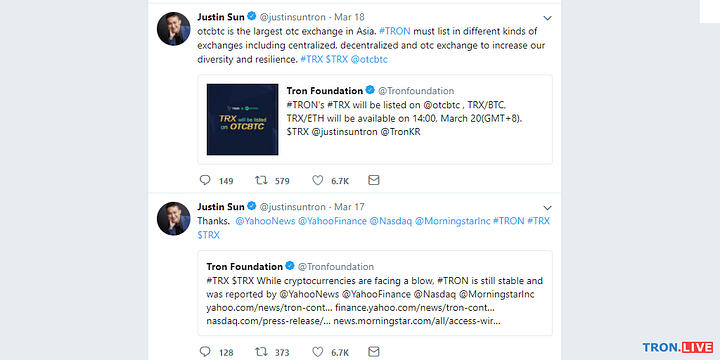
It should be noted that on this date, most other cryptocurrencies are facing a blow and dropped in price. However, TRON’s price didn’t stay for long there and had a rebound because it was less than 2 weeks before the launch of TRON’s test net. On this date, TRON foundation and Justin Sun also made a tweet announcing TRX will be added to OTCBTC on Mar 20. OTCBTC is the largest over-the-counter (OTC) exchange in Asia.
Mar 31, 2018
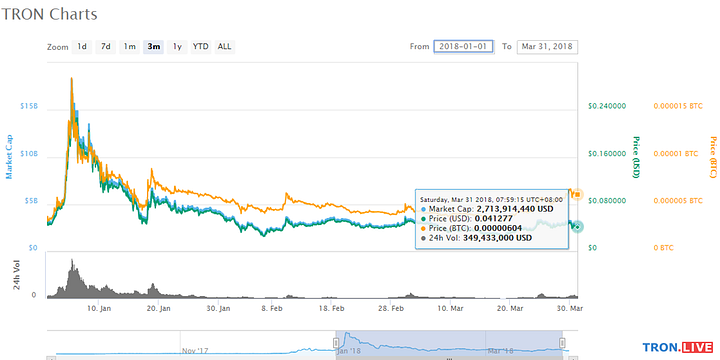
TRON testnet launched on Mar 31. As it approaches the launch of testnet, the price of TRX gained momentum and reaches about $0.05 just before testnet, and the price dropped afterward. On March 31, TRON had a market cap of 2,713,914,440 USD
TRON’s price for USD: 0.041277 and
TRONS’s price for BTC: 0.00000604
A familiar trading pattern?
Is it coincidence or is it deliberate? Every time before an important event, the price of TRON will shoot up and then on the event date and after, the price will go back down. This is no coincidence and there is actually a saying to this — “Buy the rumors, sell the news”. If you are not aware of it, do some research on it and you can see that this actually does not happen to TRX alone but to most other cryptocurrencies as well.
So, when there’s an announcement, people will speculate and those with large buying powers (known as whales) will stock up their position before the event, the drive up in price will create a hype and more new investors will follow through, driving the price further up. By the time the event actually happened (or just before the important dates), the whales will dump their holdings and take the profit they make. Therefore, if you are one of those who bought in close to or at ATH, stop calling TRON a scam coin because this happened to almost every other coins as well. If you truly believed in the technology and innovation of TRON, keep HODLing and you will see the benefit that it gives in the near future. Remember that crypto is not all about the price, it is the actual value that it brings to change our lives.
TRON’s progress in Q1
If we take out all the bits and pieces in the middle and just look at how TRX performed from the beginning of Q1 till the end of Q1, this is what we get.
TRON’s price for USD on Jan 1: 0.044682
TRON’s price for USD on Mar 31: 0.041277
TRON’s price increase for USD in Q1: -7.6%
What! TRX dropped in price? Remember we just mentioned before that crypto is not all about the price? Let’s have a closer look at how TRX performed in terms of BTC.
TRONS’s price for BTC on Jan 1: 0.00000320
TRONS’s price for BTC on Mar 31: 0.00000604
TRON’s price increase for BTC in Q1: 88.8%
Well, that sounds better. Some may say only 88.8%, isn’t this low?
Remember that we are currently in the bearish market and most cryptocurrencies are not performing well in Q1. Let’s take a look at how our crypto ancestor — bitcoin performed in Q1.
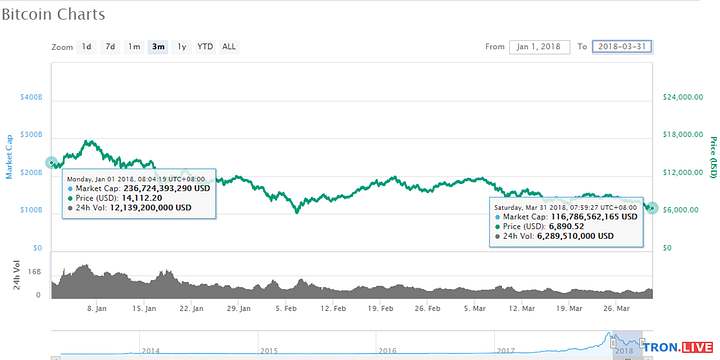
Bitcoin’s price for USD on Jan 1: 14,112.20
Bitcoin’s price for USD on Mar 31: 6,890.52
Bitcoin’s price increase for USD in Q1: -51.2%
After seeing this, do you still think TRON didn’t perform well in Q1? In our opinion, we think this is a great progress for 3 months in a bearish market. Let’s not forget about the other achievements that TRON have made so far.
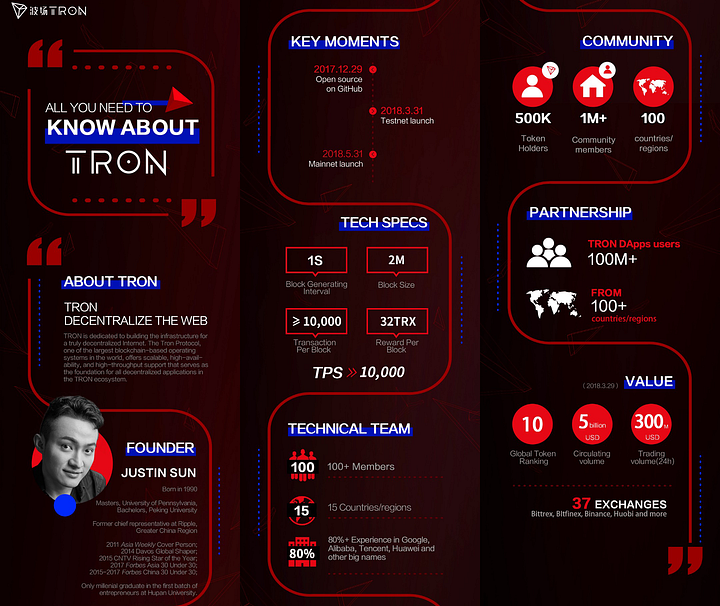
You may read our full article on An overview of Justin Sun’s TRON testnet live stream for more info if you haven’t done so.
That’s all for now! If you enjoy the read, hit the clap button and keep holding it to give us as many claps as you can. Even if you don’t have a Medium account, sign one up now which takes less than a minute and clap to show your appreciation. The more claps we get, the more exposure this article will get and the more people will be informed about the great progress of TRON.
Feel free to check out our twitter and newly created YouTube channel on the links below, subscribe for future updates.
Until next time, bye.

